I have a Zurich standard PRSA, its by and large invested in equities, Eurozone equity , Dividend growth , international equities, 5*5 asia pacific, etc . So I was surprised that the pension value is down so much about 14% over last month. I also have normal share trading account outside of pension which has same investment theme mainly UK, Europe and rest of world with not that much US and that is only down 7% or so over last month . Also when you look at monthly charts for eurostoxx 600 down 10%, nikkei 225 down 10% and S&P 500 down 6%, that suggests that zurich funds should at most be down 10% since they are by and large components of those huge global indices, but they are down alot more??
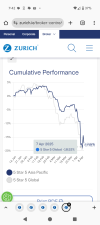
I was surprised that this prsa was down so much , also how do you find a daily price chart for a zurich fund to see what is really happening? For example it will tell you what the bid and offer price is today but not what the daily prices are for last month just generic stuff like how it has performed in percentage terms over last 6 months , 1 year, 5 years etc.
I was surprised that this prsa was down so much , also how do you find a daily price chart for a zurich fund to see what is really happening? For example it will tell you what the bid and offer price is today but not what the daily prices are for last month just generic stuff like how it has performed in percentage terms over last 6 months , 1 year, 5 years etc.
Last edited:
.png")