Alternatives to Nasdaq 100

@zephyro

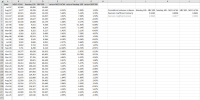
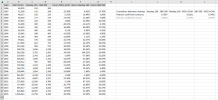
I looked at the correlation between Nasdaq 100, S&P 500, and MSCI All world using the 1 January values for each year from 1986 to 2025 inclusive. The results are copied in from Excel to the table below:

Nasdaq- S&PNasdaq- MSCIS&P-MSCI
Pearson Coefficient
0.982841038​
0.97858094​
0.99573​


As you can see, even though Nasdaq - MSCI have the lowest correlation, it's still 97.8% correlation. Anything over 80% is considered very strong. 97.8% is near perfect correlation. S&P Vs MSCI is even higher (the MSCI started in Dec 1978 so I had a few more years of data to compare with the S&P).

  • How is diversification achieved by investing in a global index instead of the Nasdaq 100 or S&P 500?
  • How is it even an argument to say that this index has outperformed the comparators over the last four decades and that's the biggest reason to believe it will underperform them going forward?
The numbers strongly suggest that the Nasdaq 100 is overvalued, as is the S&P and the MSCI. Between about 15% and 25% according to the back of my envelope. But so what? It's long term investment for me, and periods of over- & under-valuation are part of that cycle and factored into my planning- if my pension fund drops by 20% in the morning that will actually leave me exactly on track.

I'm not looking to defend the Nasdaq 100 as an investment choice. But I'm 100% going to follow the numbers and not my heart.

@joe sod Pointing only to the specific isolated data points which support your fixed opinion is pretty much the definition of cherry-picking. For example, you've totally ignored my actual numbers from 2001 to 2020 and now you've moved your focus to 2002 to 2014.
  • In case you're wondering (and because I was wondering, and also for sh1ts and giggles) I plugged in 2002-2014 into my spreadsheet for a DCA into the Nasdaq 100 on January 1st of each year, with the same adjustment for inflation. My money would have almost exactly doubled before accounting for currency fluctuations and inflation (which I couldn't be bothered to check because you clearly don't care what the numbers say anyway).
 
It's not cherry picking, because now you are standing on top of one peak looking back down at the valley and the other peaks
Regardless of past performance, valuations, PE ratios, etc. absolutely nobody can say for certain that any market/index has peaked at any point in real time.
 
Big Notorious - I am glad you asked this question. I have thought it for so long. Everyone here seems to think that the records over the last 40 years don't matter. I wonder then why all of the experts talk about historical S&P returns if past returns mean nothing at all. And someone here mentioned that US tech companies are nothing exceptional. that may be the case, but the vast amount of people on earth use US tech companies every single day! I don't think they are going anywhere too soon. I will continue to invest a good 50% of my portfolio in primarily US tech index funds. This is for the long term, I do not plan to draw down anytime soon, so I am very comfortable with my decision.
 
looked at the correlation between Nasdaq 100, S&P 500, and MSCI All world using the 1 January values for each year from 1986 to 2025 inclusive. The results are copied in from Excel to the table below:

Nasdaq- S&PNasdaq- MSCIS&P-MSCI
Pearson Coefficient
0.982841038​
0.97858094​
0.99573​


As you can see, even though Nasdaq - MSCI have the lowest correlation, it's still 97.8% correlation. Anything over 80% is considered very strong. 97.8% is near perfect correlation. S&P Vs MSCI is even higher (the MSCI started in Dec 1978 so
I just had a look at the msci world index country weights for 1987, the US was 32% , Japan was 40%. So if Japan had a much higher proportion than the US in 1987 and the Nasdaq was a much smaller proportion of even US markets in 1987, how are you getting this strong correlation between global index and Nasdaq all the way back to 1986? Are you sure you are calculating correctly and even if by coincidence you happen to come up with a strong correlation it is meaningless when you actually look at the make up of global indices back in the 1980s. Sometimes you have to stand back and look at real what it's happening, the numbers can still throw up garbage
 
@joe sod

So the hill you are 100% ready to die on is that the numbers and statistics which undermine your fixed and immovable opinion are, must, and can only be completely meaningless? You showed me yours, I told you how small it is, and your reaction is to say my measuring tape is broken?
  • Edit: the historical data for all three indices is freely available online, and it only takes a few minutes to find a youtube video on how to find the correlation between two sets of data. Most people have Excel. It's the work of maybe 10 minutes for someone to prove my calculations to be actually wrong if in fact they are wrong. Unless Bill Gates & Microsoft are also in deep with the conspiracy to make returns on this particular index look good when they are apparently in fact crap.

Well, this thread is certainly starting to turn into another online monument to Leon Festinger. Which is always disappointing.

@wanttoretire

Ditto. But if the numbers support moving to a different long term investment, I'll move.
 
Last edited:
@BIG-notorious of course MSCI World is totally dominated by US technology companies, obviously indexes that are not would be needed for diversification. Significant past outperformance affects the discount rate and therefore the expected return of financial assets
 
Nasdaq- S&PNasdaq- MSCIS&P-MSCI
Pearson Coefficient
0.982841038​
0.97858094​
0.99573​

I did a similar calculation and I have doubts about these figures. Have you calculated the correlation between the price in USD? You need to calculate the correlation between the returns not the price.
 
Last edited:
@zephyro

According to @joe sod in the 1980s US stocks were a minority of the MSCI and Nasdaq 100 were a minority of that minority. The numbers a quick google reveal US stocks only went above 50% for a brief period between 1987 and 2012 for example. Notwithstanding their attitude to numbers in general, today's dominance of the MSCI by US stocks doesn't account for the extremely high correlation between the indices over the last 40 years.

And would you have any suggestions for such indices which are not dominated by US stocks so I can run the numbers?

Can you explain (ideally with a real example) about the discount rate and expected return? The last time I encountered discount rates it was in the context of using government bonds as a baseline with which to compare any investment which wasn't a government bond basically. Or the cost of capital required for the investment which is a different side of the same coin.

@Corola I used the price (ie starting at 132 in 1986 and ending at 21750 in 2025 for the Nasdaq 100) and not the returns. It seems more appropriate for a long term investment. I'd imagine the correlation is far lower and possibly near zero for the percentage increase or decrease in any any particular year (assuming that's what you mean by "returns" and I'm not misinterpreting). As said before, volatility is expected and for that reason I don't care about annual returns, just longer (minimum 5 years) gains (or losses obviously, but even over 5 year periods it's gains the very large majority of the time.
  • I haven't done a comparison between total return indices either even though that's what I'm effectively in because the period covered by the Nasdaq 100 is so much shorter in the ones I found. From what I could find the total returns of S&P 500 are about 2% higher than the S&P 500 raw, while Nasdaq 100 total returns are about 0.8% higher.

Can you share your results for comparison? Copy & paste from my spreadsheet below (would just attach the file but it seems to have my name embedded in it!) Formula for the Pearson Coefficient is =PEARSON(B2:B41, C2:C41)

YearNasdaqS&PMSCINasdaq- S&PNasdaq- MSCIS&P-MSCI
2025​
21750​
6100​
1026433​
Pearson Coefficient
0.982841038​
0.97858094​
0.99573​
2024​
16667.3​
4,742.83​
810844​
N:
40​
40​
40​
2023​
11038.42​
3,824.14​
693317.2​
T Statistic
32.84623674​
29.30295607​
66.492063​
2022​
16395.51​
4,796.56​
727460.1​
DF:
38​
38​
38​
2021​
12950.22​
3,700.65​
573858.3​
p value:
1.66007E-29​
2020​
8802.22​
3,257.85​
545799.3​
2019​
6198.68​
2,510.03​
445997.4​
2018​
6431.59​
2,695.81​
440101.2​
2017​
4900.85​
2,257.83​
405120.6​
2016​
4485.06​
2,012.66​
340700.7​
2015​
4258.6​
2,058.20​
346716.8​
2014​
3575.6​
1,831.98​
271031.5​
2013​
2727.67​
1,462.42​
232917​
2012​
2323.16​
1,277.06​
206651.4​
2011​
2238.66​
1,271.87​
204996.2​
2010​
1882.69​
1,132.99​
168580.7​
2009​
1212.74​
931.8​
134504.6​
2008​
2085.53​
1,447.16​
197928.5​
2007​
1769.22​
1,416.60​
228281.2​
2006​
1654.39​
1,268.80​
209844.8​
2005​
1628.75​
1,202.08​
166724.4​
2004​
1474.16​
1,108.48​
159004.6​
2003​
995.64​
909.03​
130512​
2002​
1590.71​
1,154.67​
204023.8​
2001​
2341.28​
1,283.27​
239650.9​
2000​
3755.74​
1,455.22​
242288.3​
1999​
1836.01​
1,228.10​
180796.6​
1998​
990.8​
975.04​
153184​
1997​
821.36​
737.01​
117069.8​
1996​
576.23​
620.73​
99611.21​
1995​
404.27​
459.11​
81266.12​
1994​
398.26​
465.44​
93042.3​
1993​
360.18​
435.38​
65599.62​
1992​
330.86​
417.26​
63619.83​
1991​
200.53​
326.45​
53696.04​
1990​
223.84​
359.69​
67633.18​
1989​
177.4​
275.31​
66530.24​
1988​
156.25​
255.94​
48537.91​
1987​
141.4​
246.45​
51380.59​
1986​
132.29​
209.59​
40978.07​
1985​
165.37​
40978.07​
1984​
164.04​
38486.36​
1983​
138.34​
30654.86​
1982​
122.74​
21023.75​
1981​
136.34​
16881.14​
1980​
105.76​
14463.17​
1979​
96.73​
11222.64​
1978​
93.82​
10398.93​
 
Correlation between absolute price is not a meaningful statistic. You need to divide the price in each period by the previous one to get the annual return. Then find the Pearson coefficient between the returns of each index.

I didn't find easily 1986 prices. I downloaded a .csv from https://curvo.eu/backtest/en/compare-indexes/nasdaq-100-vs-msci-acwi?currency=usd#evolution to compare monthly returns since 2007. I imagine they are less correlated if you take a longer period, for the same reasons as @joe sod.
 

Attachments

  • pearson.PNG
    pearson.PNG
    78.5 KB · Views: 22
Last edited:
@Corola

Thanks. I'd disagree with you on using annual return rather than price as relevant correlation in assessing a long term investment but anyway.

I'm very surprised that that the correlation between the returns is so high from 2007 onwards. 89% is still very strong, I was expecting much lower. 2007 onwards isn't a huge set of data points (even my 40 years is shorter than I'd like) but even taking that into account the correlation is surprisingly (to me) strong.
 
@BIG-notorious you could use European/Japanese/Emerging indexes for example, but even if you redo calculations correctly the relevance of past returns is much less important than the diversification benefits now if US technology stocks underperform from here as may be anticipated based on estimated expected returns

couldn't explain discount rates and expected returns better than the best academic reviews for example:
https://papers.ssrn.com/sol3/papers.cfm?abstract_id=1820084 (Discount Rates by John H. Cochrane)
 
Last edited:
It's not surprising that these indexes are highly correlated when they're all subsets of each other. The higher correlation in more recent periods reflects that Nasdaq makes up a larger portion of MSCI than it used to.

The relevant correlation to measure diversification isn't between Nasdaq and MSCI, it's between the stocks in Nasdaq and the stocks in MSCI that aren't in Nasdaq.
 
Last edited:
@zephyro Thanks.

I won't pretend I understood more than 10-15% of that paper but my take home (correct me if this is the wrong take home) is that right now expected returns are pretty low because asset prices are high. That's fair, and my assumption is that the Nasdaq will drop or grow more slowly in the coming years. The 20% or so annualised for the last 10 years is stupidly unsustainable no matter how you look at it.

I'll also look for some of those indexes for comparison. Ideally there's a well performing index which isn't so highly correlated with US stocks/the Nasdaq.

The big difficulty I have though is though that "if" in your post. It seems unreasonable to assume that an index which has underperformed for decades will turn around and start over-performing. Yes the numbers say US prices should be lower but they've been saying that for a good few years. And one could equally argue that German or UK stock prices should be higher (if the EU push to increase retail investment is successful that may be the result).

Ultimately I still find it difficult to ignore 40 years of data showing Nasdaq 100 outperforming. It's equally difficult to ignore relative long term underperformance.

Still. That's the closest I've gotten so far to an empirical argument for diversification with a different index. So it's progress!
 
I used your table to calculate the correlations since 1986. The correlation between returns is much lower (0.63) when you look further back.

The correlation between price is meaningless with regards to diversification, it's always close to 1. It only tells you the three indexes have an upward bias. It doesn't tell you how they move together at any given point of time.
 

Attachments

  • pearson_1986.PNG
    pearson_1986.PNG
    66.4 KB · Views: 17
Last edited:
@Corola

Thanks. Every day is a school day! The correlation is much weaker, but still in fairness remains strong.

@galway_blow_in

Tax treatment really isn't any sort of a consideration for my pension fund (where the vast majority of my investments are) as growth is tax free. It's more a consideration for the smaller one, but it's going to be a tradeoff between gains & tax. Assuming ETF taxation isn't equalised with CGT by the time I cash it in or deemed disposal date is reached in 8 years.
 
Well. My posts in this thread have in many ways aged terribly in a short period of time. Although to be fair, the Nasdaq can fall at least another 10% before it starts touching the upper limits of where it "should" be based on long term trends.

As I've swapped out my non-pension long-term savings to Berkshire Hathaway it will be interesting to see which performs better in the next 10-15 year. It's academic (for me) for the next decade at least.

I've no intention of moving away from US equity on the basis of the last few months; that would in my opinion be just as foolish as moving into US equity on the basis of last year's Trump Bump. (Timing Vs Time-in the market, being right twice, flow of money from the impatient to the patient etc etc).
 
I referred to the JAM investment trust earlier,I see it's no longer available through DeGiro, I left Saxo because of this, Saxo were vastly superior to DeGiro
 
Well. My posts in this thread have in many ways aged terribly in a short period of time. Although to be fair, the Nasdaq can fall at least another 10% before it starts touching the upper limits of where it "should" be based on long term trends.
Never expected things to turn that quickly myself, can blame agent orange in the white house and all the looneys around him.
The implications for us defence and by extension us tech stocks over trump hobbling Ukraine and threatening kill switches on us defence equipment will have far reaching consequences as nobody will buy us defence equipment over the control that a lunatic like trump has over the use of such equipment.
And if now that Europeans will invest in their own defence industries with huge spending that is great for European technology going forward as the 2 will feed off each other
 
Back
Top