Colm Fagan
Registered User
- Messages
- 763
Below is what Brian Woods, who some on this forum may know, posted this afternoon on LinkedIn about an index devised by BNP Paribas.
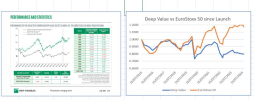
The Index, which Colm Fagan and I call the Deep Value (DV) Index, was created by BNP Paribas. We have completed a detailed study of its performance.
The graphic below illustrates the mystery.
BNP Paribas launched the DV index in July 2015. In their presentation they explained how, by using a novel technique of enhancing the number of cum-dividend shares in a price only index and other aspects such as low volatility, options on DV would be cheaper than on its benchmark EuroStoxx50 (ES50). When they simulated this DV creation back to 2001 they found the remarkable gravity defying result that DV had grown to c.176% while ES50 had declined to c.74%, a relative outperformance against its benchmark of c.237% despite the inbuilt cum-dividend drag!!
For the first few years post-launch DV matched its benchmark despite this inbuilt drag. Then (possibly with very unfortunate timing) Broker Solutions launched the Secure Accelerator Bond (SAB) series in Ireland. This would pay 40% plus, if DV simply did not finish below its starting value in five years. 1,304 back-tests in the brochure showed that the 40%+ would always have been achieved. Colm and I complained formally to the Central Bank that the brochure was potentially misleading but it was a few years before they got round to addressing the issue, too late for the investors in SAB.
Back to DV vs ES50, after the initial quiet period of going live, gravity asserted itself and despite the benchmark very comfortably surpassing its initial value in the 5 years, DV finished well below its benchmark and crucially below its starting level, leaving SAB customers at a loss!! We are aware that this has completely mystified customers and advisors alike.
The before and after launch experience are so starkly different that Colm Fagan and I decided to test the statistical significance of the difference. We used the actual experience since launch as our data base and boot strapped a million simulations of the pre launch experience. The best result of the entire million simulations of relative performance was 202%, way below the actual 237%.
It could well be that our method is seriously flawed but can AAM contributors who are more expert than us on statistics comment on this?
Activate to view larger image,