Brendan Burgess
Founder
- Messages
- 52,214
Coronavirus - The Irish Times
I was wondering where they got the figure of it being down from 30% to 15%.
If they have decided from just yesterday to only now start contact tracing without having tested it would also imply of worsening conditions that they are not saying
As said on another thread, the numbers are strange and there are many on-point comments in this thread. So just to add,
1. It's hard to comment on the shape of the curve with incomplete data
2. Regarding the decrease in the rate of growth, is the following not what's happening (not actual figures - just to illustrate the concept) given the ceiling in the number of cases processed?
Day Opening New Total Increase x 1,000 250 1,250 x+1 1,250 250 1,500 X+2 1,500 250 1,750 x+3 1,750 250 2,000 x+4 2,000 250 2,250 x+5 2,250 250 2,500 x+6 2,500 250 2,750
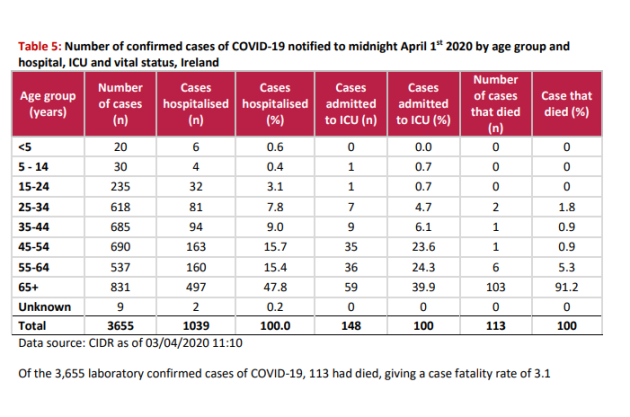
They are arguing, with huge caveats, that the rate of growth is down from 30% a few weeks ago to 15% today.
EmmDee,
My example was simply in relation to Brendan's comment - which is a fair representation of the messaging.
Or it could just as easily imply that the number of infections/average number of contacts per case is dropping which is allowing the staff to expand their criteria. Really just depends on your outlook on the situation I guess.
 www.thejournal.ie